Resource Workload & Availability Analysis view
Working with project budgeting & planning, budget entries are created for which the report offers alternative views. The Resource Workload & Availability Analysis view is based on budget entry table with additional filters to limit the display such as for skills, resource group or line manager.
In parallel with project planning, a resource often does its own individual planning in the Outlook calendar. For this purpose, the analysis also provide a view of individual Outlook entries.
To access the matrix, choose the  icon, enter Resource Workload & Availability Analysis, and then choose the related link.
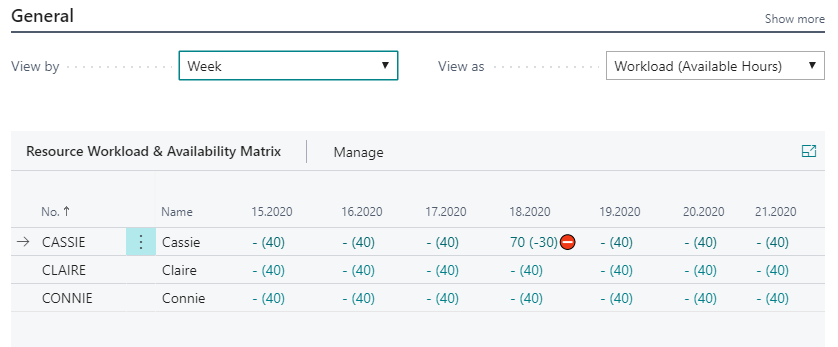
- In the View By field, specify by which period you want the amounts to be displayed.
- In the View As filed, specify which data you want view.
- In the Line Filter FastTab, limit the resources you want to view.
- In the Entry Filter FastTab, limit the data you want to view.
View As filter options
The View As option filter offers the following alternative views of the data:
| View As | Data showed | Data showed within () | Color visualisation |
|---|---|---|---|
| Order | Budget hours where project status = Order | - | Budget hours on order in % of capacity where green >= 75; yellow >= 60; red < 60 |
| Quote | Budget hours where project status = Quote | - | - |
| Order + Quote | Budget hours where project status = Order OR project status = Quote | - | Budget hours on Order AND Quote in % of capacity hours where green >= 75; yellow >= 60; red < 60 |
| Calendar | Hours in Outlook calendar | - | - |
| Workload (Availability) | Budget hours where project status = Order | Available hours, calculated as capacity hours - Budget hours on order | Available hours in % of Capacity hours where red <50 |
Note
Icon alert showed in Workload (Availability) if workload hours >110% of capacity hours.
Line Filter
Line Filters options limit the resources showed in the matrix
| Line Filter | Description |
|---|---|
| Resource Group No. | Show only resources connected to the resource group(s) within the filter |
| Line Manager | Show only resources connected to the line manager(s) within the filter |
| Skill Filter | Show only resources connected to the skill(s) within the filter |
| Global Dim 1 Filter | Show only resources for global dimension 1 |
| Global Dim 2 Filter | Show only resources for global dimension 2 |
Entry Filters
Entry Filter options limit the data showed for each resource
| Entry Filter | Description |
|---|---|
| Project No. | Show only data for Project(s) within the project no. filter |
| Global Dim 1 Filter | Show only data for global dimension 1 |
| Global Dim 2 Filter | Show only data for global dimension 2 |
See Also
Timesheet Status Analysis view