Timesheet Status Analysis view
As the Timesheet is processed, it passes a set of statuses. The Timesheet Status Analysis view is based on time entry table and offers alternative views for per resource.
To access the analysis view, choose the  icon, enter Resource Timesheet Status Analysis, and then choose the related link.
- In the View By field, specify by which period you want the amounts to be displayed.
- In the View As filed, specify which data you want view.
- In the Line Filters FastTab, limit the resources you want to view.
- In the Entry Filters FastTab, limit the data you want to view.
View As filter options
The View As option filter offers the following alternative views of the data:
| View As | Data showed | Data showed in () | Color visualisation |
|---|---|---|---|
| Open on Timesheet | Hours on timesheet with status = Open, meaning they have not yet been submitted. | Capacity | Open hours on timesheet in % of capacity where green >= 100; black >= 80; red < 80 |
| Submitted | Hours on timesheet with status = Approval OR status = Waiting Posting (in journal). | - | |
| Rejected | Hours on timesheet with status = Approval | - | All data showed in red. |
| Approved | Hours on timesheet with status = Posted meaning usage has been created. | - | - |
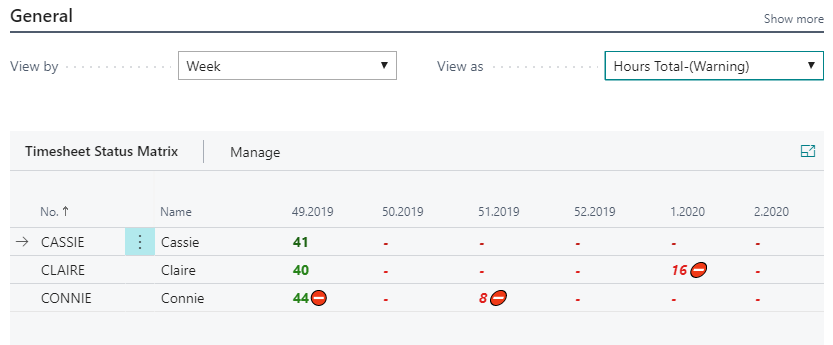
| Total | Total Hours | - | Total hours in % of capacity where green >=100; black >=90; red <90 |
Note
Icon alert showed if total hours > approved hours meaning there are hours on timesheet not fully processed.
Line Filters
Line Filters options limit the resources showed in the matrix:
| Line Filter | Description |
|---|---|
| Resource Group No. | Show only resources connected to the Resource group(s) within the filter |
| Line Manager | Show only resources connected to the Line manager(s) within the filter |
| Global Dim 1 Filter | Show only resources for global dimension 1 |
| Global Dim 2 Filter | Show only resources for global dimension 2 |
Entry Filters
Entry Filters options limit the data showed for each resource:
| Entry Filter | Description |
|---|---|
| Project No. | Show only data for Project(s) within the Project No. filter |
| Project Manager | Show only data for Project Managers within the Project Manager filter |
| Person Responsible | Show only data for Person Responsible within the Person Responsible filter |
| Global Dim 1 Filter | Show only data for global dimension 1 |
| Global Dim 2 Filter | Show only data for global dimension 2 |
See also
Resource Workload & Availability Analysis view